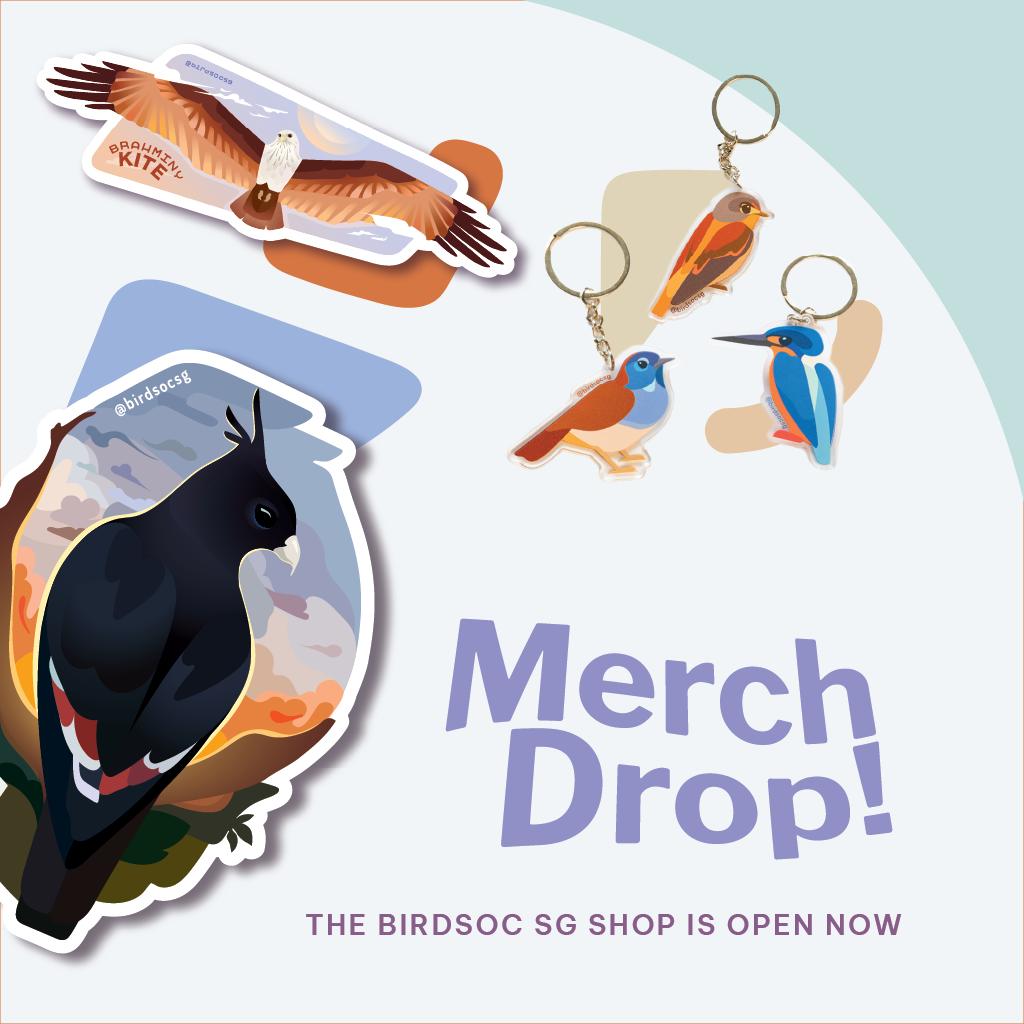
The latest update of our checklist, version 2023-1, has been published. It can be accessed at our Downloads page.
Since our last checklist update in August 2022, the Records Committee has considered and voted on over 180 records of rare and scarce birds in Singapore. We would like to thank all the observers who submitted their records, and these votes are published on our Recent Decisions page with our Live Checklist tracking additions and deletions to the checklist on a live basis.
Our “Rarities List” was renamed, as the term Review List more effectively encompasses the full list of species that we track records for; several species on our Review List might not fit the description of ‘rare’. For more information on the workings of the Records Committee, please refer to our simplified operating guidelines which have been published on our About page.
Over 500 historical records have also been compiled by our team and added since August, and nearly all species on our Review List now have records compiled in our database.
This article includes the updates to our checklist since our last revision. Our checklist is based on the International Ornithological Committee (IOC) taxonomy, the latest version being IOC 13.1 – released this month. The checklist also contains national conservation statuses from the newly-released Red Data Book 3.
This edition of the checklist is version 2023-1, and can be downloaded at our Downloads page. Note that this downloadable checklist is a “snapshot” of the checklist as of February 2023, and may differ from our live checklists available on this site and our Records Committee site. For example, you may have noticed the below additions to the checklist already appearing on our live checklists by late last year – when they were finalised by our Records Committee – even though they are only reflected in our downloadable checklist in this official update.
There are now 428 species in the Singapore Bird Checklist with the changes in this revision.
Added to checklist
Black-headed Ibis Threskiornis melanocephalus [Record 10358]: One bird at Sungei Buloh Wetland Reserve in early Nov 2022 placed this species in Category A. Our recent article discusses the committee’s rationale for unanimously accepting this record as a wild bird.
Buff-vented Bulbul Iole crypta is removed from the checklist as the last accepted record was in Oct 1992, exceeding the 30-year cutoff for native birds to be included in Category A. Subsequent records after 1992 have not been accepted.
Other minor changes
Barred Eagle Owl moves from Bubo to Ketupa, so its scientific name goes from Bubo sumatranus to Ketupa sumatrana.
Black-headed Ibis at Sungei Buloh Wetland Reserve. Photo credit: Francis Yap
Buff-vented Bulbul at Panti Forest. Photo Credit: Francis Yap
Brown-breasted Flycatcher in Sri Lanka. Photo: Dillen Ng
Twitching and dipping, words I have never heard before. Now, during my Big Year (a personal challenge to see as many species of birds as possible in one calendar year), I would never be more familiar with those two words.
I remember seeing Jen Wei’s Facebook post summarising his epic 2021 Big Year, and being mesmerised by the sheer number of mega rarities all compiled in one photo and to think that they were all seen in a span of one year by one person! It was especially awe-inspiring to personally witness Jen Wei twitching the Yellow-vented Flowerpecker at Bukit Timah summit.
With major exams and other school commitments set to gradually build up over the next few years, I decided that Secondary 1 was a relatively free year to take on the monumental, time-consuming mission of a big year. Nonetheless, the life of a student is still crammed with school related activities, leaving me with much limited time for recreation. Birding only on weekends and holidays practically shortened my ‘big year’ to less than half a year. Every hour spent off the field was truly nerve-wracking – whenever I checked my phone after school, I would be distraught to see reports of rarities, praying that the bird would stay a week for me to twitch. That being said, even if it was challenging, that was what made it so fun.
In the course of the year, among all the lucky finds and successful twitches, two birding encounters made a particularly special impression on me.
It was 18th September and based on trends from data on eBird and SBP, Forest Wagtails would have started passing through Singapore en route to their wintering grounds. However, none were reported recently from the famous wagtail roost at Yishun. An encounter with this elusive bird on Rifle Range Link would otherwise necessitate an ankle-breaking hike at the crack of dawn. Taking a gamble of luck, I decided to head down to Yishun. The wagtails would usually fly in to roost at 6:15, leaving me with 45 minutes to search for the Forest Wagtail before nightfall. I climbed every block, checking each palm tree meticulously. Half an hour passed, and my determination was fading as I routinely scanned through hundreds of commoner Grey Wagtails. At that moment, just as my patience was wearing thin, I noticed a bird that was significantly different. An olive-green and white wagtail with a contrasting triangular black bib on its breast – a Forest Wagtail! Words cannot describe the satisfaction of finding the needle in a haystack, something special hidden within the common birds.
As the year drew to an end, it was naturally becoming increasingly hard to obtain new year birds. Since June, I had been trying sporadically to find the supposed resident pair of Cinnamon-headed Green Pigeons on the west end of Pulau Ubin. Pulau Ubin was one of the most rewarding sites for my year list, with many dispersants and visitors appearing on this small but significant island between Malaysia and main island of Singapore, but yet one of the least accessible and out of the way. Birding at Ubin was always an arduous and tiring task, not to mention the need to pay for a bumboat ride to and from the island, and a taxi to take us to opposite ends of the vast nature sanctuary that it is. With dreadful stories of many failed twitches of these nomadic, unpredictable pigeons, I decided not to give up on this beautiful bird yet, and returned to Ubin one last time in November before I went overseas. Thus, I arranged to bird with my friend Joshua and his brother for an entire day, in the hopes of giving my year list a final push. When we arrived at Changi Ferry Terminal, it was deserted save for two idle fishermen. Our sought-after pigeons were previously sighted in the early hours of the morning and time was of the essence. Out of desperation, my mother decided to pay an extra fee so we could fill the boat and leave early. As the boat set sail, we were off to a good start, having spotted an unexpected Lesser Crested Tern from the boat, trailing a flock of Greater Crested Terns along the coastline at the break of dawn. Stepping foot onto the sleepy island, rain clouds gathered ominously, and we reached Ubin Living Lab just before rain started to pelt down, forcing us to take shelter. We solemnly counted the passing swifts and swallows as we awaited the cessation of the rain. Little did we know, us being grounded by the passing thunderstorm would become a blessing in disguise. Out of the blue, Joshua spotted two Treron pigeons zooming past the shelter. Even before raising my binoculars, I could immediately see the distinct chestnut head and maroon wings of a male Cinnamon-headed Green Pigeon. I was melting on the floor in sheer joy. Later on in the day, we would go on to see a Broad-billed Sandpiper at Chek Jawa, my landmark 300th Singapore lifer, but yet, this pigeon, number 299, stood out to me as special, by far the most memorable experience throughout my entire big year, and it was because of my mother’s support and my friend’s help.
After this, my year list started to plateau, partly due to my travels and the shortage of rarities appearing in December. On 28th December, I found the adult male Blue Rock Thrush at the urban rooftops of The Pinnacle@Duxton – my 284th year bird and the final one of my Big Year. Including ‘plastic birds’, my year count was 300, meaning I managed to see 82.2% of all the species seen over the course of 2022.
As a student, over the course of the year, I learnt how to balance my studies with my hobby effectively. I also realised how connected the birding community is in Singapore, whenever a “star bird” is discovered, the news is always generously shared allowing all to enjoy the presence of it. I have learned so much from the community and have improved my skills significantly, not only in the field, but out of the field, with regards to identifying birds.
Another main difficulty I faced during my Big Year was deciding where to go to maximise my chances of ticking a year bird. Tools that proved to be extremely useful for my Big Year was eBird’s target species function and Singapore Birds Project’s data. eBird allows a simple and easy view of all the year birds I had yet to tick and shows the spots where they have been spotted before, by month. eBird was also very useful in being able to compile my year list and be able to track my progress easily without needing to painstakingly keep my list manually. (eBird is a community science initiative, meaning that this function only works because of the many diligent eBird users submitting their checklists and sightings so I encourage more birders to start using eBird!) Singapore Birds Project’s Singapore Bird Database and Migrant Bar Charts are phenomenal, providing up-to-date information on rarities, allowing better predictions on when and where to go to find certain target species.
I would like to thank all my birding friends especially Jamie, Qian Xun, Pluem, Samuel, Gideon and Joshua for being great company. Secondly, I want to thank Francis, Oliver, Vincent Ng, Keita, Jen Wei, Jared, Raghav and many others for the guidance in the field and amazing finds throughout the year. Lastly I also would like to thank CN and Benjamin Lee for the advice and tips and congratulate them on their impressive Big Year counts!
However, without the support of my parents, my Big Year count would have been a far cry from what it turned out to be. As the year progressed, my appreciation for my parents grew deeper and deeper. At a moment’s notice, my parents were always ready to rush me down whenever a rarity was spotted. Accompanying me on my birding endeavours, they drove me across the entire Singapore no matter how near or how far. Whenever I was disheartened from an unsuccessful twitch or when I was bursting with pride after a great find, my parents were always there supporting me. My Big Year would not be possible without them and I am forever grateful to be able to have such a thrilling and enriching Big Year with memories that I will cherish for a lifetime.
The many walks along the rooftops of Pinnacles were not in vain as I ended off my Big Year with the Blue Rock Thrush on 28th December, a bird which I missed by seconds on my first attempt.
On 16th November, it was so satisfying to witness the majestic Greater Spotted Eagle soaring above Mount Faber after many failed attempts.
Black and Red Broadbill, a very lucky find following my twitch of the Ruby Cheeked Sunbird on 28th May at Sungei Buloh Wetlands Reserve
After many hours of waiting and 10+ attempts, one final trip on 11th January yielded the Asian Emerald Cuckoo at Jurong Lake Gardens
Scanning through the flocks of Redshanks and Whimbrels for an entire week was worth it when on 8th September, the Marsh Sandpiper showed itself hidden among the more common waders.
Skipping dinner was worth it to witness the Barn Owl lurking underneath the Benjamin Sheares Bridge on 5th June
My most productive raptor watching day was 6th November with 4 year birds with the most noteworthy being the 12th record of a Besra.
In a recent post, we covered the why of our migrant bar charts – what motivated us to design a new way to present migration data? In this post, we will try to explain how our methodology works, and look at some examples of the algorithm in action.
Heatmap of Yellow-rumped Flycatcher observations from Jul-Dec 2021. How do we combine so many sightings across the island into a single estimate of the number of individuals seen?
Recently, a large volume of work in the field of ecology has been concentrated on generating robust avian population estimates, with a variety of different methods. One feature common to a number of the techniques has been a focus on applying citizen science data, especially from the eBird platform, as in Hansen et al. (2022).
Over the last few months we have designed a straightforward technique to model migration patterns and trends in Singapore. Rather than making population-wide range and abundance estimates which require more sophisticated methods, like in eBird Status and Trends (Fink et al., 2021), we instead focus only on analyzing occurrences within Singapore, which are fine-grained and relatively well-represented in citizen science datasets such as eBird.
The effect of confounding variables such as uneven effort distribution is relatively low due to Singapore’s small size and high observation density, so our approach only incorporates recorded observations and makes no attempts to estimate unknown quantities using extrapolation.
We consolidate observation data using spatial and time-based constraints. Important terminology that we use to describe the process are defined:
Sighting: one eBird observation of a species, extracted from the eBird dataset; the important information which is used is: species name, number of individuals, date, and location.
Record: one or more eBird observations of a species where the observations in question all relate to the same individual(s) – one record may comprise sightings of different numbers of individuals
Individual: a single bird of one species, may be seen multiple times or just once, and alone or together with other individuals
What this all means is that we need a method to map sightings to individuals. For instance, consider the following sightings of Yellow-rumped Flycatchers in late Sep 2021.
Location
Count
Date
Tuas Bay Street
1
25-Sept-21
Jurong Lake Gardens (inc. Chinese Garden and Japanese Garden)
1
25-Sept-21
Jurong Lake Gardens (inc. Chinese Garden and Japanese Garden)
2
26-Sept-21
Changi Business Park
1
26-Sept-21
Singapore Botanic Gardens
3
26-Sept-21
Dairy Farm Nature Park
2
26-Sept-21
Tuas South (Tuas South Avenue 16 and surrounds)
4
26-Sept-21
Jurong Lake Gardens (inc. Chinese Garden and Japanese Garden)
1
30-Sept-21
Singapore Botanic Gardens
1
30-Sept-21
Tuas South (Tuas South Avenue 16 and surrounds)
2
30-Sept-21
Simply choosing the high count of 4 is not a good idea, since there are clearly more than 4 unique birds in the table here. At the same time, adding them up won’t work because the 26 Sep sighting and the 30 Sep sighting at Tuas could possibly involve the same birds.
So our approach is summarized as follows:
For each species, we deliberate and determine a reasonable “date threshold” which determines the maximum date difference between two sightings for them to be grouped together as one record. For raptors, the threshold is normally a shorter period because most sightings are of birds just passing through. Winter visitors will have longer thresholds.
For any species, our algorithm will “lump” sightings across multiple dates into a single record if the gap between them is less than or equal to the decided threshold and the sightings are less than 2km apart.
We repeat this process for every sighting until they are all categorized. Each record will have one or more sightings.
To estimate the number of individuals observed during the timeframe, we take the highest count of individuals sighted in each record and add them all together.
The below example is a color-coded example showing how each sighting is grouped according to location and date. The total number of individuals outputted by the algorithm, for the period 25 Sep to 30 Sep, would be 12, which is the sum of 1, 2, 3, 2, and 4 (highest count for each respective record, listed in bold in the table below).
#
Location
Count
Date
1
Tuas Bay Street
1
25-Sept-21
2
Jurong Lake Gardens (inc. Chinese Garden and Japanese Garden)
1
25-Sept-21
2
Jurong Lake Gardens (inc. Chinese Garden and Japanese Garden)
2
26-Sept-21
2
Jurong Lake Gardens (inc. Chinese Garden and Japanese Garden)
1
30-Sept-21
3
Changi Business Park
1
26-Sept-21
4
Singapore Botanic Gardens
3
26-Sept-21
4
Singapore Botanic Gardens
1
30-Sept-21
5
Dairy Farm Nature Park
2
26-Sept-21
6
Tuas South (Tuas South Avenue 16 and surrounds)
4
26-Sept-21
6
Tuas South (Tuas South Avenue 16 and surrounds)
2
30-Sept-21
After dividing the year into week-long chunks and taking the average over ten years, the result is quite smooth and matches our prior understanding quite well. In the case of Yellow-rumped Flycatcher, we can see the two clear peaks in fall and spring.
Migrant bar chart for Yellow-rumped Flycatcher. An interactive version is available here.
How our approach compares with other publicly-available statistics
The other main source of bar charts is on eBird. Because eBird is built for users around the world, it cannot take advantage of the unique features of data in Singapore: namely the high density of observations here compared to other places. We wrote about how our method differs from statistics available on eBird in our earlier post, which has a full explanation.
Limitations
This method of course only yields estimates, as some – not many – sightings which are from the same location are listed at different eBird hotspots which are more than 2km apart. Also, sometimes birds may hang around longer or shorter than the threshold decided for the species. The other problems that come from working with citizen science data are also reflected, like in the case of misidentification, incorrect location data, incorrect date information, and so on. Generally, the impact of these issues is not large and tends to cancel out, but are still problems to be aware of.
The data is also not intended to be a population estimate but rather an estimate of the observed number of individuals. The difference is that we do not infer records where data is not available, which would allow for a complete population estimate.
The algorithm is also optimized for Singapore’s uniquely high number of active observers, coupled with the tightly-packed hotspots here. In larger countries, the distance between observations would make it difficult to apply our approach.
Further possible improvements and applications of the model
In future, we hope to further improve the model by considering low counts which may be the result of undersampling rather than actual low abundance. Particularly for pelagic species, higher perceived abundance may be due to a lower number of pelagic trips during certain times of the year.
We may also attempt to extend the model to display spatial abundance in addition to temporal abundance, to highlight the best areas for different species.
Conclusion
We wrote this post to highlight the key features of the algorithm which serves as the foundation for our newly-released migrant bar charts. Besides these charts, it also forms a basis for our internal analyses and discussions, which eventually lead to work such as our Records Committee’s rarities list.
We’ll continue to document any further updates to our methodology in a timely manner, and as always, constructive criticism is very valuable and will help us improve going forward. Please feel free to contact us!
References
Hansen, B. D., Rogers, D. I., Watkins, D., Weller, D. R., Clemens, R. S., Newman, M., Woehler, E. J., Mundkur, T., & Fuller, R. A. (2022). Generating population estimates for migratory shorebird species in the world’s largest flyway. Ibis, 164(3), 735–749. https://doi.org/10.1111/ibi.13042
Fink, D., T. Auer, A. Johnston, M. Strimas-Mackey, O. Robinson, S. Ligocki, W. Hochachka, L. Jaromczyk, C. Wood, I. Davies, M. Iliff, L. Seitz. 2021. eBird Status and Trends, Data Version: 2020; Released: 2021. Cornell Lab of Ornithology, Ithaca, New York. https://doi.org/10.2173/ebirdst.2020
I’m sure many of us have used eBird bar charts in the past, and they’ve certainly helped me in deciding where to go birding or what to look for. So why did we make our own migrant bar charts here at SBP?
In this article, we’ll explore some of the drawbacks we noticed with eBird bar charts, and how our migrant bar charts stack up against eBird’s. We’ve also got a future article lined up in which we go more in-depth into the inner workings of the algorithm, so do stay tuned if you’re into that sort of thing! (Update: this post is now posted on our blog)
Because eBird is built for users around the world, it cannot take advantage of the unique features of data in Singapore: namely the high density of observations here compared to other places.
eBird mainly uses two alternative methods to try to quantify abundance/frequency for its bar charts.
Method 1
This method uses the percent of checklists in which a species appears. This does not really tell us anything, because birders go to different places during different times of the year. Let’s say a certain wader is more common in November than in September. But because many people are at Henderson Waves instead of Sungei Buloh in November, the percent of checklists which contain that wader would obviously be much lower than in September. That would not reflect the species’s true status. Another problem with this method is that a checklist with 100 individuals of a certain species counts the same as a checklist with just 1 individual. And to make matters worse, an “incomplete” checklist – one where the observer says that not all birds that were seen are listed on the checklist – is not counted at all.
A heatmap of eBird checklists in Sep for the years 2011-2021.A heatmap of eBird checklists in Nov for the years 2011-2021.
The difference between September and November is stark, despite just the two-month difference. It highlights the shift in observer coverage from shorebird areas in Sep (mainly Sungei Buloh) towards other habitats in Nov.
Method 2
The second indicator used by eBird is the highest count of a bird for a week in history. This also poses major problems. Consider the example of the Japanese Sparrowhawk Accipiter gularis. The highest count was on 13 Oct 2020, with 104 birds, and from the eBird chart, you would imagine Japanese Sparrowhawk is most common in the first half of October. But the highest count for a certain week is not the best way to gauge abundance. To take an extreme example, if we simply take the highest count, 1000 birds split into groups of 100 each would appear like a lower level of an abundance than 104 birds seen once. And indeed, this seems to be the problem with Japanese Sparrowhawks, which are far more common in end-Oct despite the high count telling us otherwise.
eBird line chart for Japanese Sparrowhawk. Note the peak in early Oct, and lower numbers in the rest of Oct and Nov.
Our approach
SBP bar chart for Japanese Sparrowhawk. An interactive version is available here.
From the above chart taken from our bar charts, you can see the peak for Japanese Sparrowhawk lies closer to the end of Oct, with rising numbers through October and falling numbers in November.
We’ve used eBird bar charts in the past too. We noticed these issues, and set out to design a more robust algorithm which uses all available data rather than only considering high counts or frequencies. The algorithm uses eBird’s dataset of observations too, but processes the sightings differently.
These new bar charts are the product of years of hard work from the Singapore birding community. Your observations have formed the basis for the raw data that we now have access to in eBird. Now, with your help, we have found a way of presenting information that is easily understood and has proper scientific grounding.
In the coming weeks, I’ll be writing about how our algorithm consolidates many thousands of individual eBird data points to estimate the abundance of each species over time – we’re always making an effort to ensure our approaches are firmly rooted in science, and striving to be transparent about it too. (Update: this second post is now posted on our blog as well)
Trying to figure out your next birding destination but don’t know what to go looking for or what to expect? We’ve got you covered!
The latest addition to the growing functionality on the Singapore Bird Database is date-based search (in addition to the existing species-based search on our page).
You’ll find, for instance, that the first days of October are a pretty busy time!
What else is new?
An “On this week” page is also live, to complement the existing “On this day” page. It’ll display all the records from history in the week from today (for today, 30 Sep, it’ll show everything from 30 Sep to 6 Oct).
We hope you’ll enjoy these new features. You can tell us if there’s anything else you want to see, or if something is wrong.
(Cover photo: Chinese Blue Flycatcher at Jurong Lake Gardens on 11 Oct 2020, photo credit: Francis Yap)
We have added 26 species to our new migrant bar charts in the last two weeks, which can be accessed HERE. They will continue to be released in batches over the coming months. To learn more about these, you can read our summary blog post.