

In a recent post, we covered the why of our migrant bar charts – what motivated us to design a new way to present migration data? In this post, we will try to explain how our methodology works, and look at some examples of the algorithm in action.
Recently, a large volume of work in the field of ecology has been concentrated on generating robust avian population estimates, with a variety of different methods. One feature common to a number of the techniques has been a focus on applying citizen science data, especially from the eBird platform, as in Hansen et al. (2022).
Over the last few months we have designed a straightforward technique to model migration patterns and trends in Singapore. Rather than making population-wide range and abundance estimates which require more sophisticated methods, like in eBird Status and Trends (Fink et al., 2021), we instead focus only on analyzing occurrences within Singapore, which are fine-grained and relatively well-represented in citizen science datasets such as eBird.
The effect of confounding variables such as uneven effort distribution is relatively low due to Singapore’s small size and high observation density, so our approach only incorporates recorded observations and makes no attempts to estimate unknown quantities using extrapolation.
We consolidate observation data using spatial and time-based constraints. Important terminology that we use to describe the process are defined:
- Sighting: one eBird observation of a species, extracted from the eBird dataset; the important information which is used is: species name, number of individuals, date, and location.
- Record: one or more eBird observations of a species where the observations in question all relate to the same individual(s) – one record may comprise sightings of different numbers of individuals
- Individual: a single bird of one species, may be seen multiple times or just once, and alone or together with other individuals
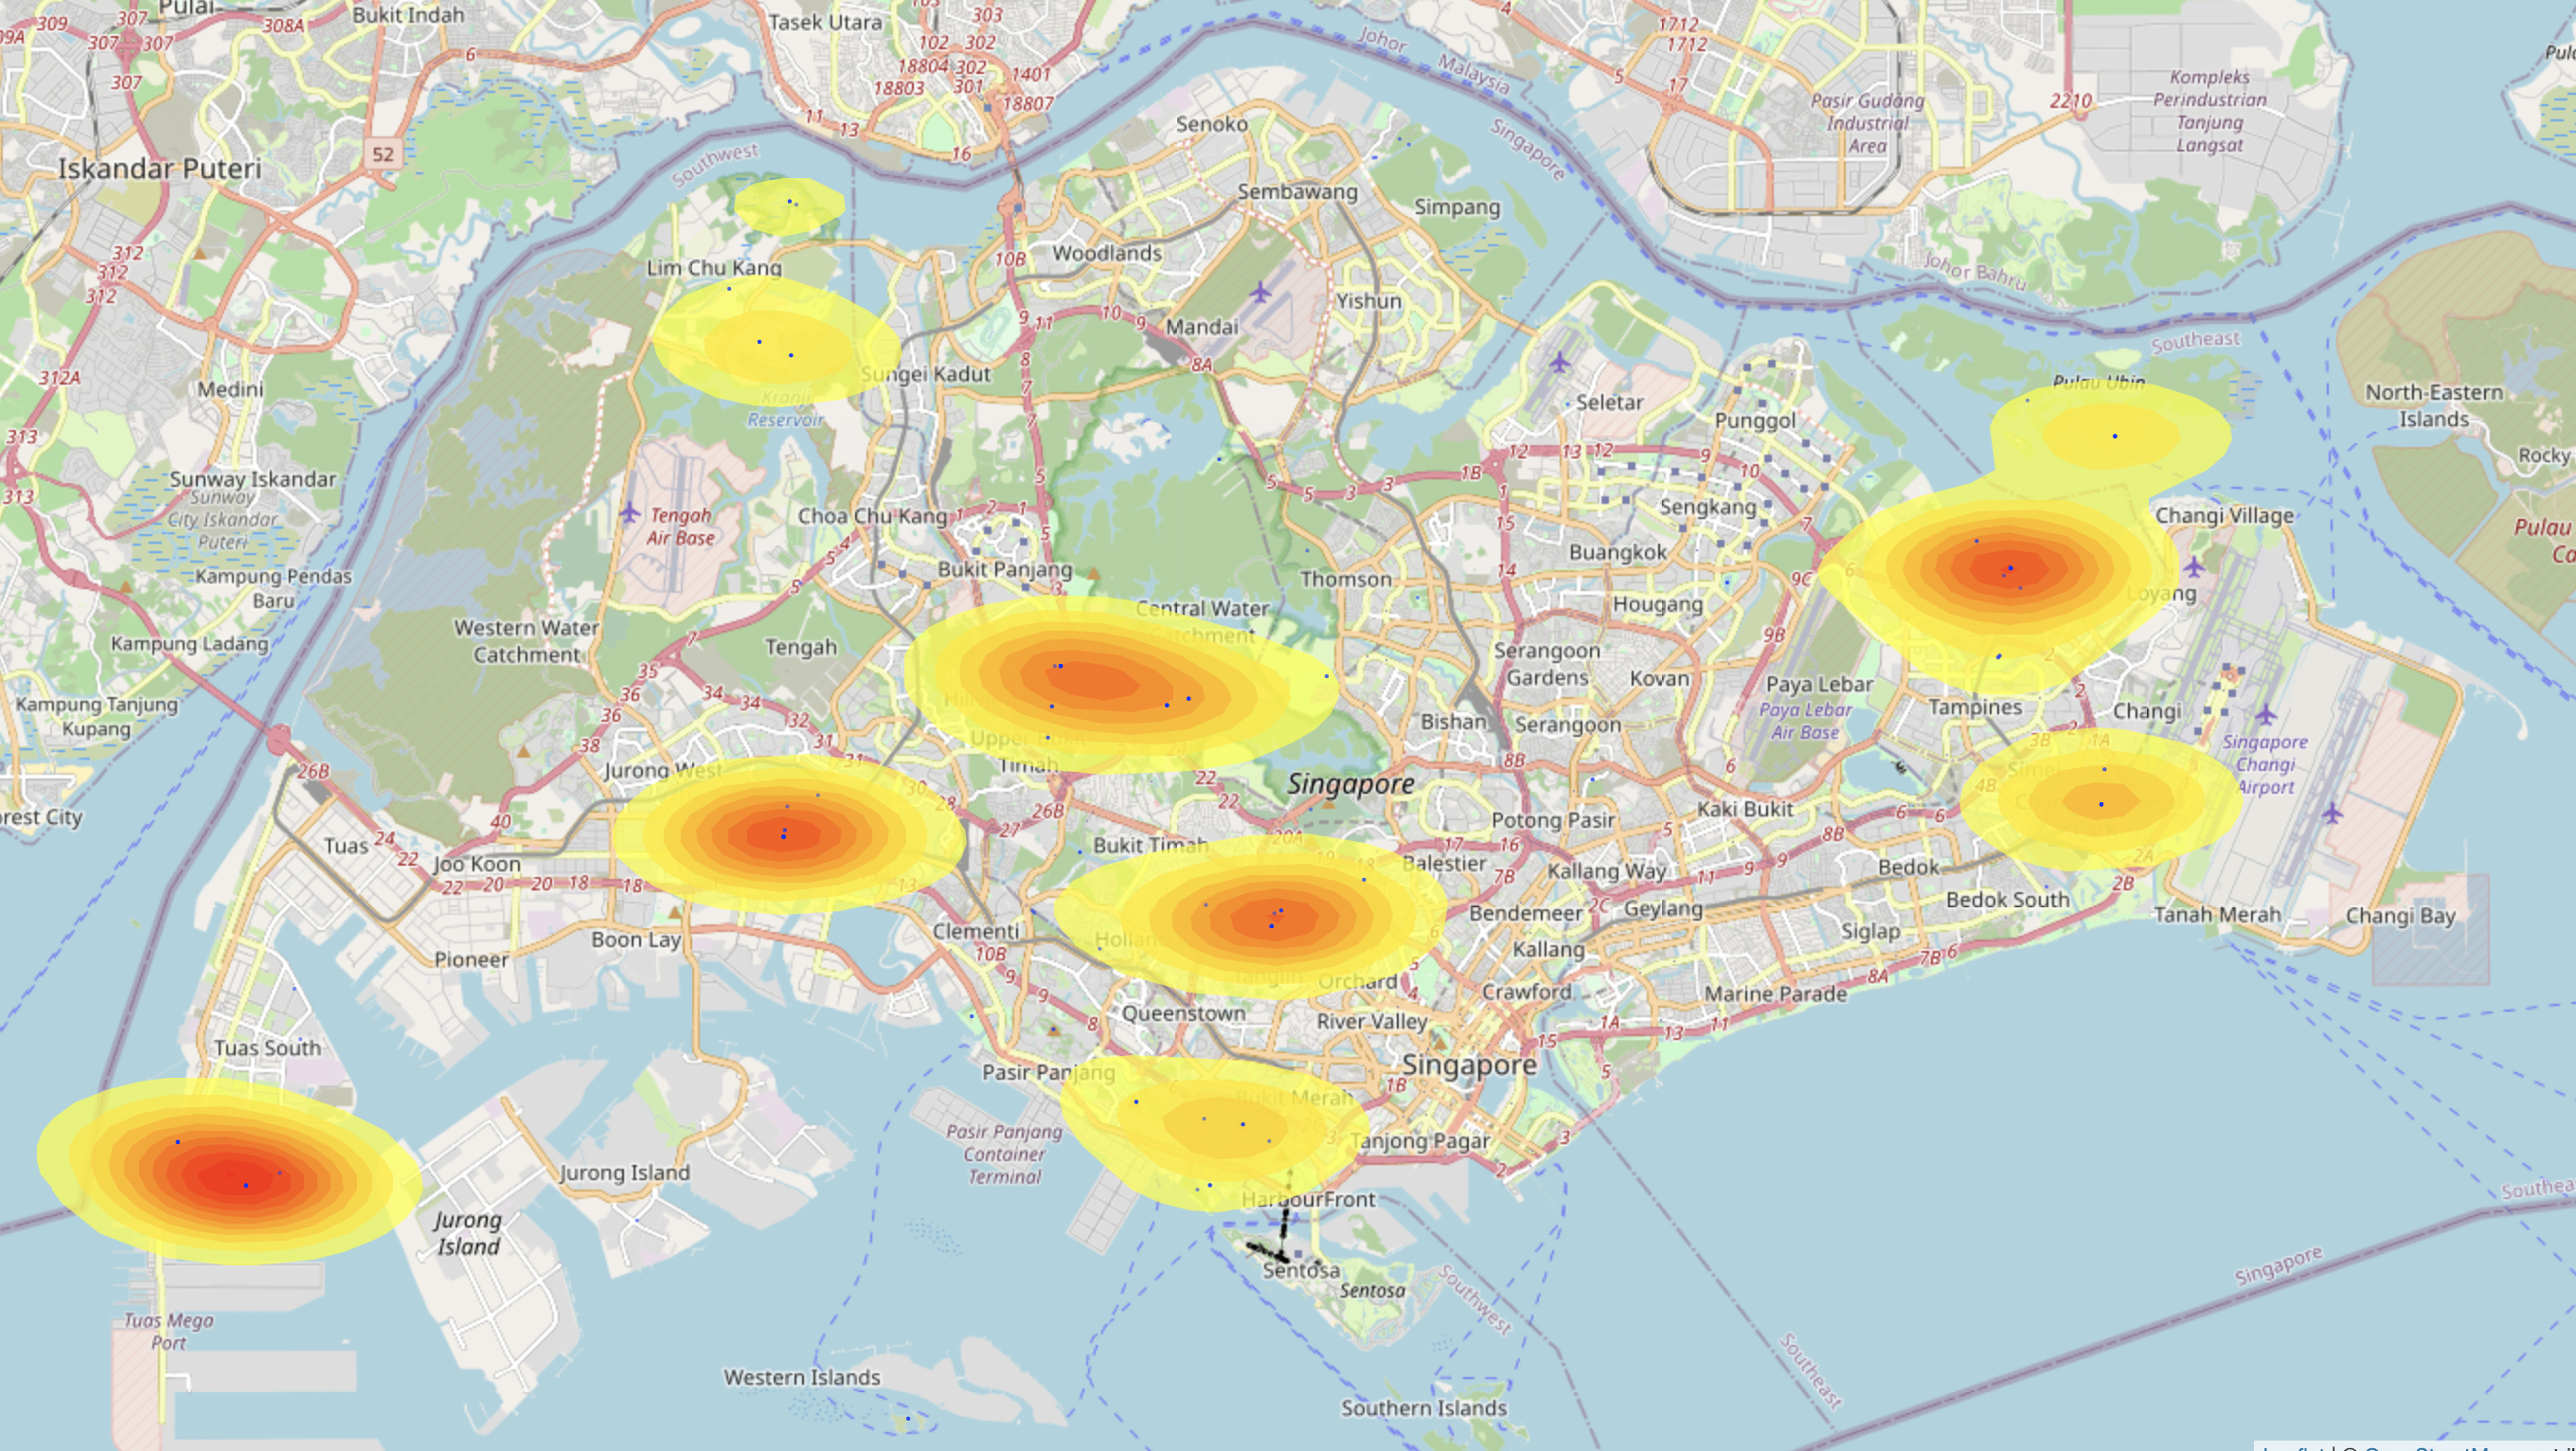
What this all means is that we need a method to map sightings to individuals. For instance, consider the following sightings of Yellow-rumped Flycatchers in late Sep 2021.
| Location | Count | Date |
| Tuas Bay Street | 1 | 25-Sept-21 |
| Jurong Lake Gardens (inc. Chinese Garden and Japanese Garden) | 1 | 25-Sept-21 |
| Jurong Lake Gardens (inc. Chinese Garden and Japanese Garden) | 2 | 26-Sept-21 |
| Changi Business Park | 1 | 26-Sept-21 |
| Singapore Botanic Gardens | 3 | 26-Sept-21 |
| Dairy Farm Nature Park | 2 | 26-Sept-21 |
| Tuas South (Tuas South Avenue 16 and surrounds) | 4 | 26-Sept-21 |
| Jurong Lake Gardens (inc. Chinese Garden and Japanese Garden) | 1 | 30-Sept-21 |
| Singapore Botanic Gardens | 1 | 30-Sept-21 |
| Tuas South (Tuas South Avenue 16 and surrounds) | 2 | 30-Sept-21 |
Simply choosing the high count of 4 is not a good idea, since there are clearly more than 4 unique birds in the table here. At the same time, adding them up won’t work because the 26 Sep sighting and the 30 Sep sighting at Tuas could possibly involve the same birds.
So our approach is summarized as follows:
- For each species, we deliberate and determine a reasonable “date threshold” which determines the maximum date difference between two sightings for them to be grouped together as one record. For raptors, the threshold is normally a shorter period because most sightings are of birds just passing through. Winter visitors will have longer thresholds.
- For any species, our algorithm will “lump” sightings across multiple dates into a single record if the gap between them is less than or equal to the decided threshold and the sightings are less than 2km apart.
- We repeat this process for every sighting until they are all categorized. Each record will have one or more sightings.
- To estimate the number of individuals observed during the timeframe, we take the highest count of individuals sighted in each record and add them all together.
The below example is a color-coded example showing how each sighting is grouped according to location and date. The total number of individuals outputted by the algorithm, for the period 25 Sep to 30 Sep, would be 12, which is the sum of 1, 2, 3, 2, and 4 (highest count for each respective record, listed in bold in the table below).
| # | Location | Count | Date |
| 1 | Tuas Bay Street | 1 | 25-Sept-21 |
| 2 | Jurong Lake Gardens (inc. Chinese Garden and Japanese Garden) | 1 | 25-Sept-21 |
| 2 | Jurong Lake Gardens (inc. Chinese Garden and Japanese Garden) | 2 | 26-Sept-21 |
| 2 | Jurong Lake Gardens (inc. Chinese Garden and Japanese Garden) | 1 | 30-Sept-21 |
| 3 | Changi Business Park | 1 | 26-Sept-21 |
| 4 | Singapore Botanic Gardens | 3 | 26-Sept-21 |
| 4 | Singapore Botanic Gardens | 1 | 30-Sept-21 |
| 5 | Dairy Farm Nature Park | 2 | 26-Sept-21 |
| 6 | Tuas South (Tuas South Avenue 16 and surrounds) | 4 | 26-Sept-21 |
| 6 | Tuas South (Tuas South Avenue 16 and surrounds) | 2 | 30-Sept-21 |
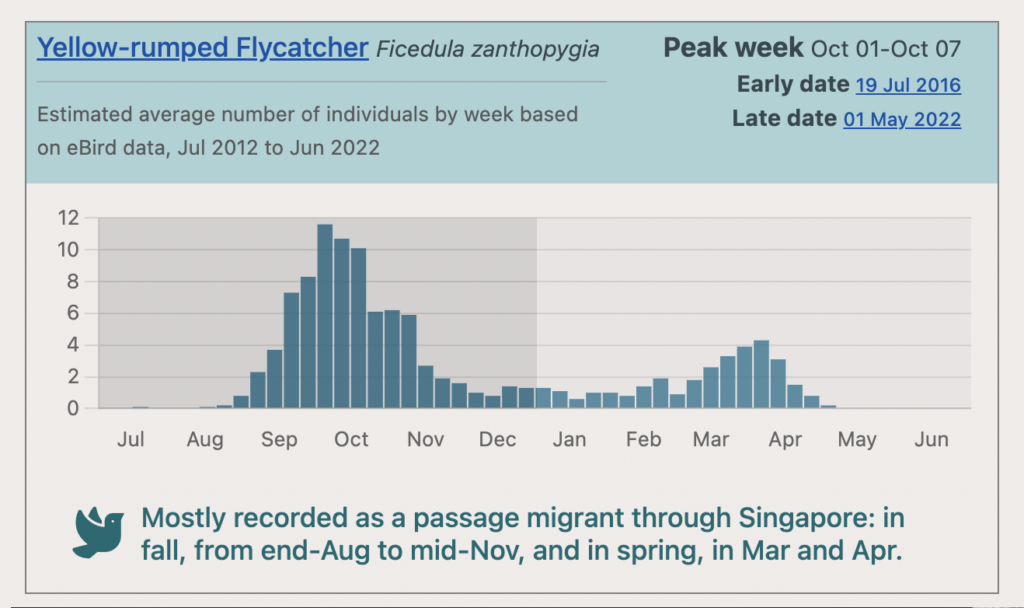
After dividing the year into week-long chunks and taking the average over ten years, the result is quite smooth and matches our prior understanding quite well. In the case of Yellow-rumped Flycatcher, we can see the two clear peaks in fall and spring.
How our approach compares with other publicly-available statistics
The other main source of bar charts is on eBird. Because eBird is built for users around the world, it cannot take advantage of the unique features of data in Singapore: namely the high density of observations here compared to other places. We wrote about how our method differs from statistics available on eBird in our earlier post, which has a full explanation.
Limitations
This method of course only yields estimates, as some – not many – sightings which are from the same location are listed at different eBird hotspots which are more than 2km apart. Also, sometimes birds may hang around longer or shorter than the threshold decided for the species. The other problems that come from working with citizen science data are also reflected, like in the case of misidentification, incorrect location data, incorrect date information, and so on. Generally, the impact of these issues is not large and tends to cancel out, but are still problems to be aware of.
The data is also not intended to be a population estimate but rather an estimate of the observed number of individuals. The difference is that we do not infer records where data is not available, which would allow for a complete population estimate.
The algorithm is also optimized for Singapore’s uniquely high number of active observers, coupled with the tightly-packed hotspots here. In larger countries, the distance between observations would make it difficult to apply our approach.
Further possible improvements and applications of the model
In future, we hope to further improve the model by considering low counts which may be the result of undersampling rather than actual low abundance. Particularly for pelagic species, higher perceived abundance may be due to a lower number of pelagic trips during certain times of the year.
We may also attempt to extend the model to display spatial abundance in addition to temporal abundance, to highlight the best areas for different species.
Conclusion
We wrote this post to highlight the key features of the algorithm which serves as the foundation for our newly-released migrant bar charts. Besides these charts, it also forms a basis for our internal analyses and discussions, which eventually lead to work such as our Records Committee’s rarities list.
We’ll continue to document any further updates to our methodology in a timely manner, and as always, constructive criticism is very valuable and will help us improve going forward. Please feel free to contact us!
References
Hansen, B. D., Rogers, D. I., Watkins, D., Weller, D. R., Clemens, R. S., Newman, M., Woehler, E. J., Mundkur, T., & Fuller, R. A. (2022). Generating population estimates for migratory shorebird species in the world’s largest flyway. Ibis, 164(3), 735–749. https://doi.org/10.1111/ibi.13042
Fink, D., T. Auer, A. Johnston, M. Strimas-Mackey, O. Robinson, S. Ligocki, W. Hochachka, L. Jaromczyk, C. Wood, I. Davies, M. Iliff, L. Seitz. 2021. eBird Status and Trends, Data Version: 2020; Released: 2021. Cornell Lab of Ornithology, Ithaca, New York. https://doi.org/10.2173/ebirdst.2020