
I’m sure many of us have used eBird bar charts in the past, and they’ve certainly helped me in deciding where to go birding or what to look for. So why did we make our own migrant bar charts here at SBP?
In this article, we’ll explore some of the drawbacks we noticed with eBird bar charts, and how our migrant bar charts stack up against eBird’s. We’ve also got a future article lined up in which we go more in-depth into the inner workings of the algorithm, so do stay tuned if you’re into that sort of thing! (Update: this post is now posted on our blog)
Because eBird is built for users around the world, it cannot take advantage of the unique features of data in Singapore: namely the high density of observations here compared to other places.
eBird mainly uses two alternative methods to try to quantify abundance/frequency for its bar charts.
Method 1
This method uses the percent of checklists in which a species appears. This does not really tell us anything, because birders go to different places during different times of the year. Let’s say a certain wader is more common in November than in September. But because many people are at Henderson Waves instead of Sungei Buloh in November, the percent of checklists which contain that wader would obviously be much lower than in September. That would not reflect the species’s true status. Another problem with this method is that a checklist with 100 individuals of a certain species counts the same as a checklist with just 1 individual. And to make matters worse, an “incomplete” checklist – one where the observer says that not all birds that were seen are listed on the checklist – is not counted at all.
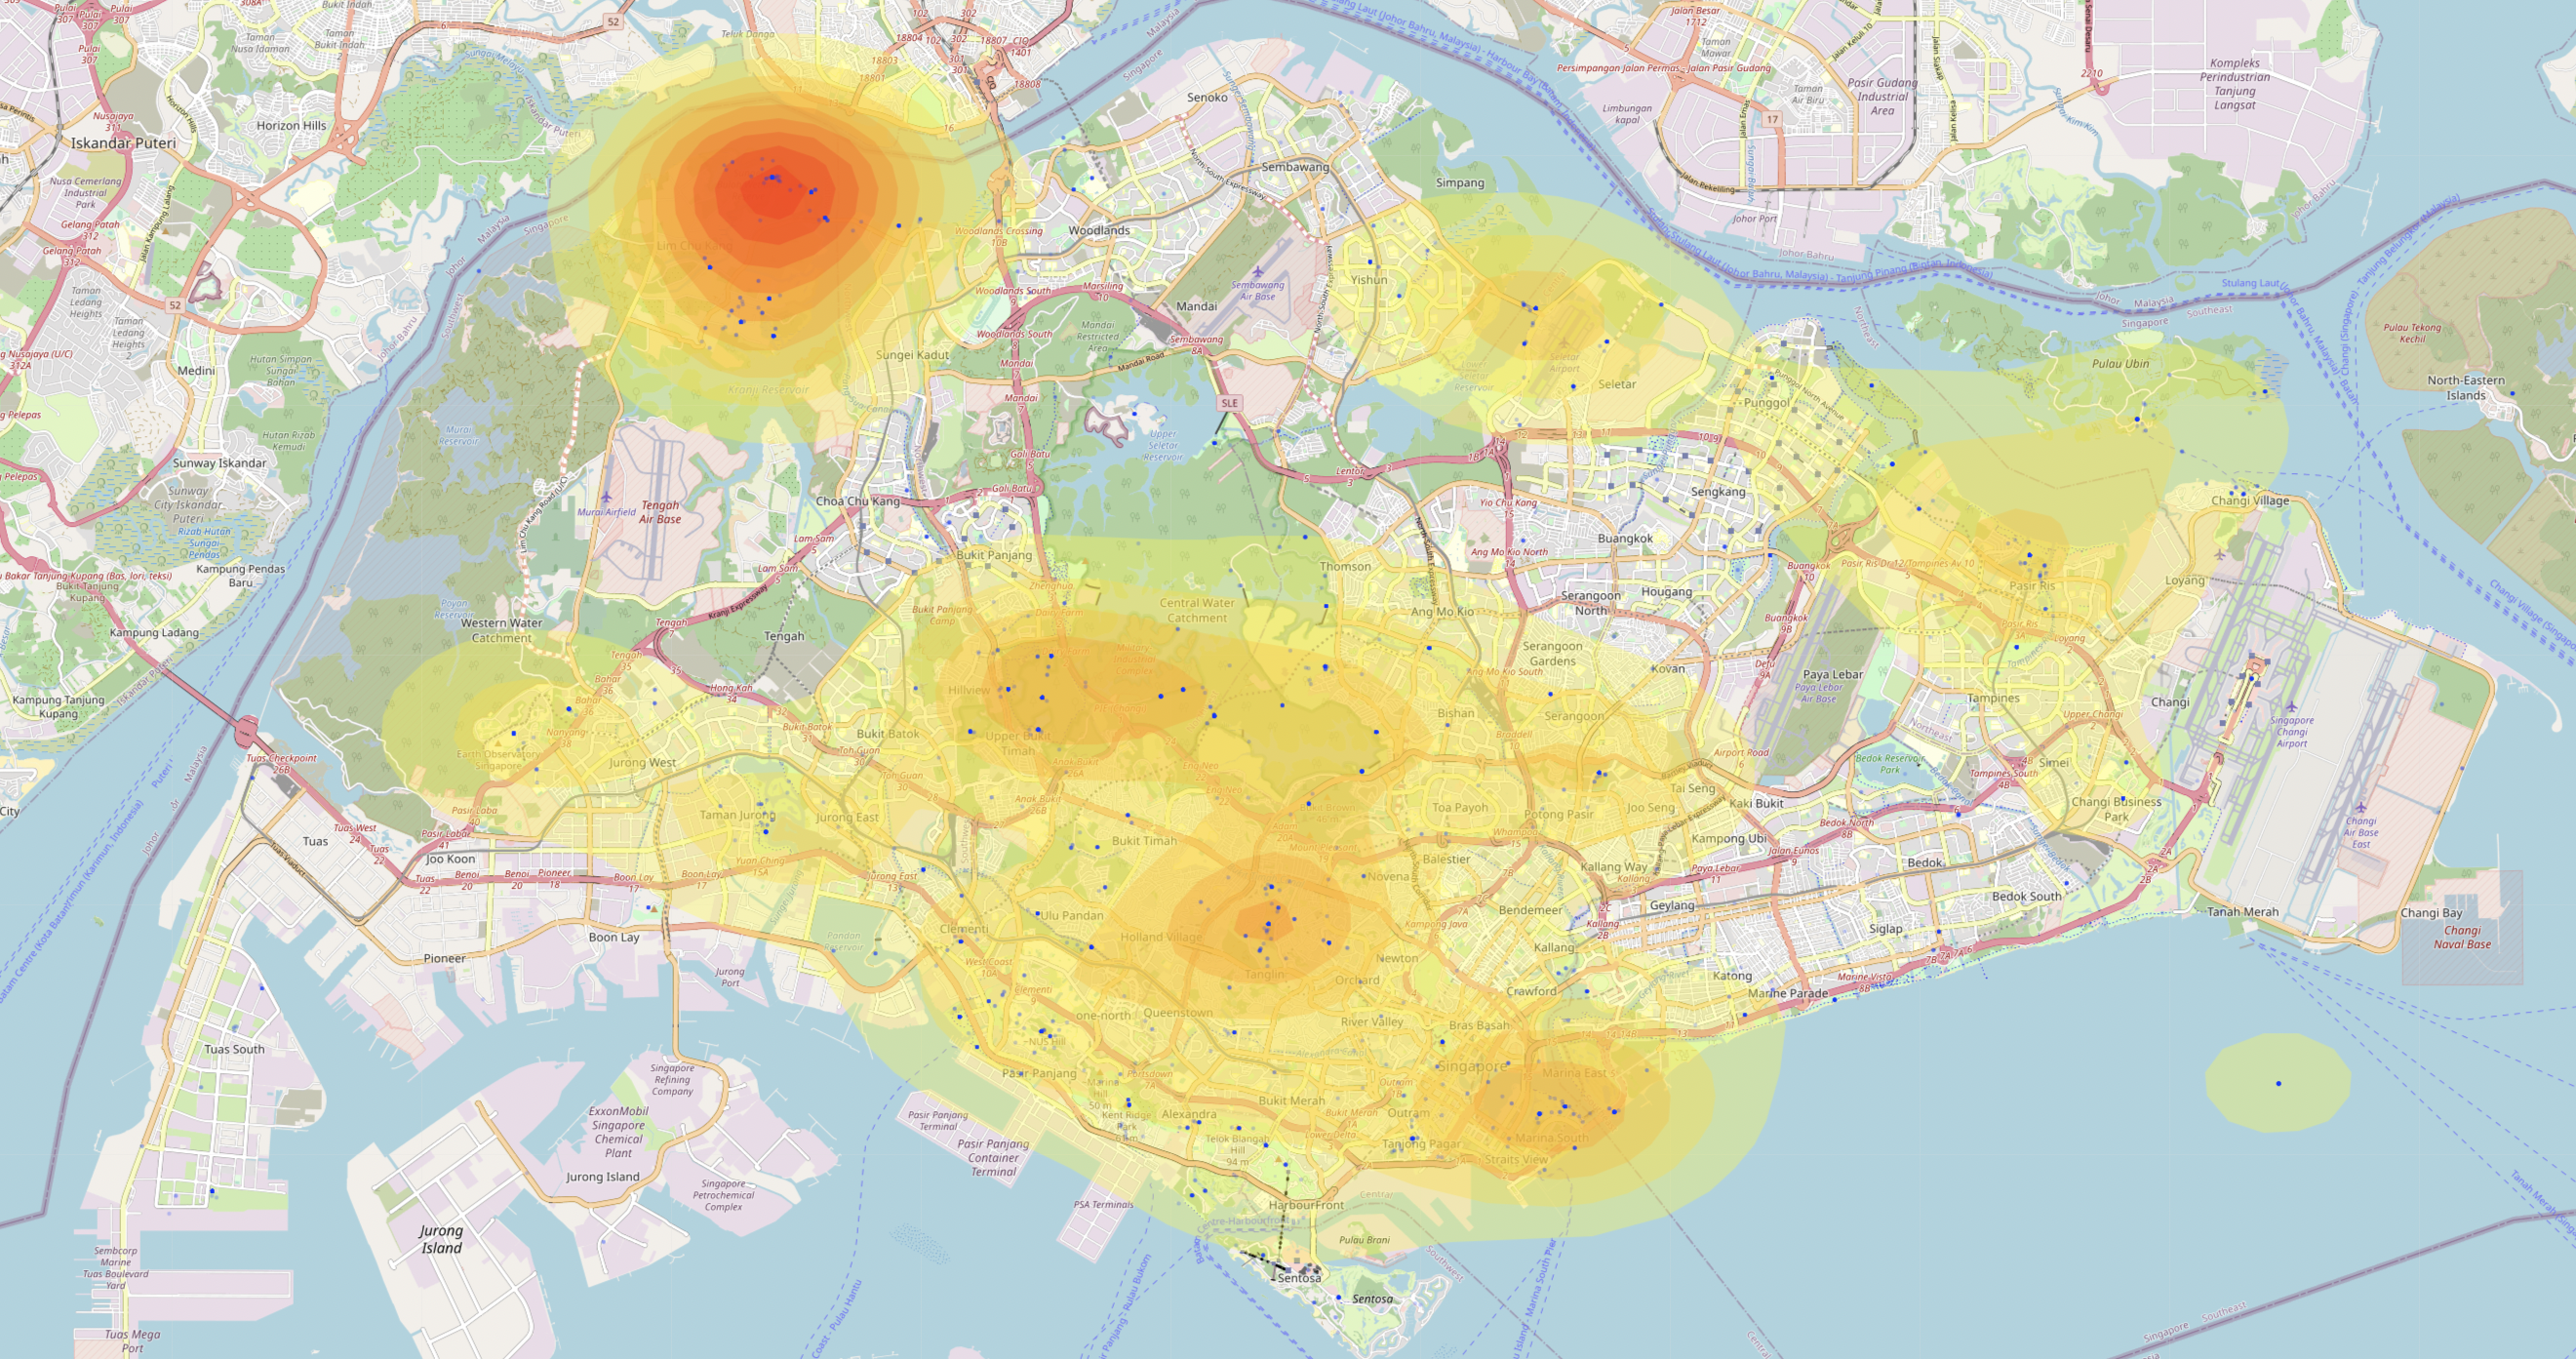
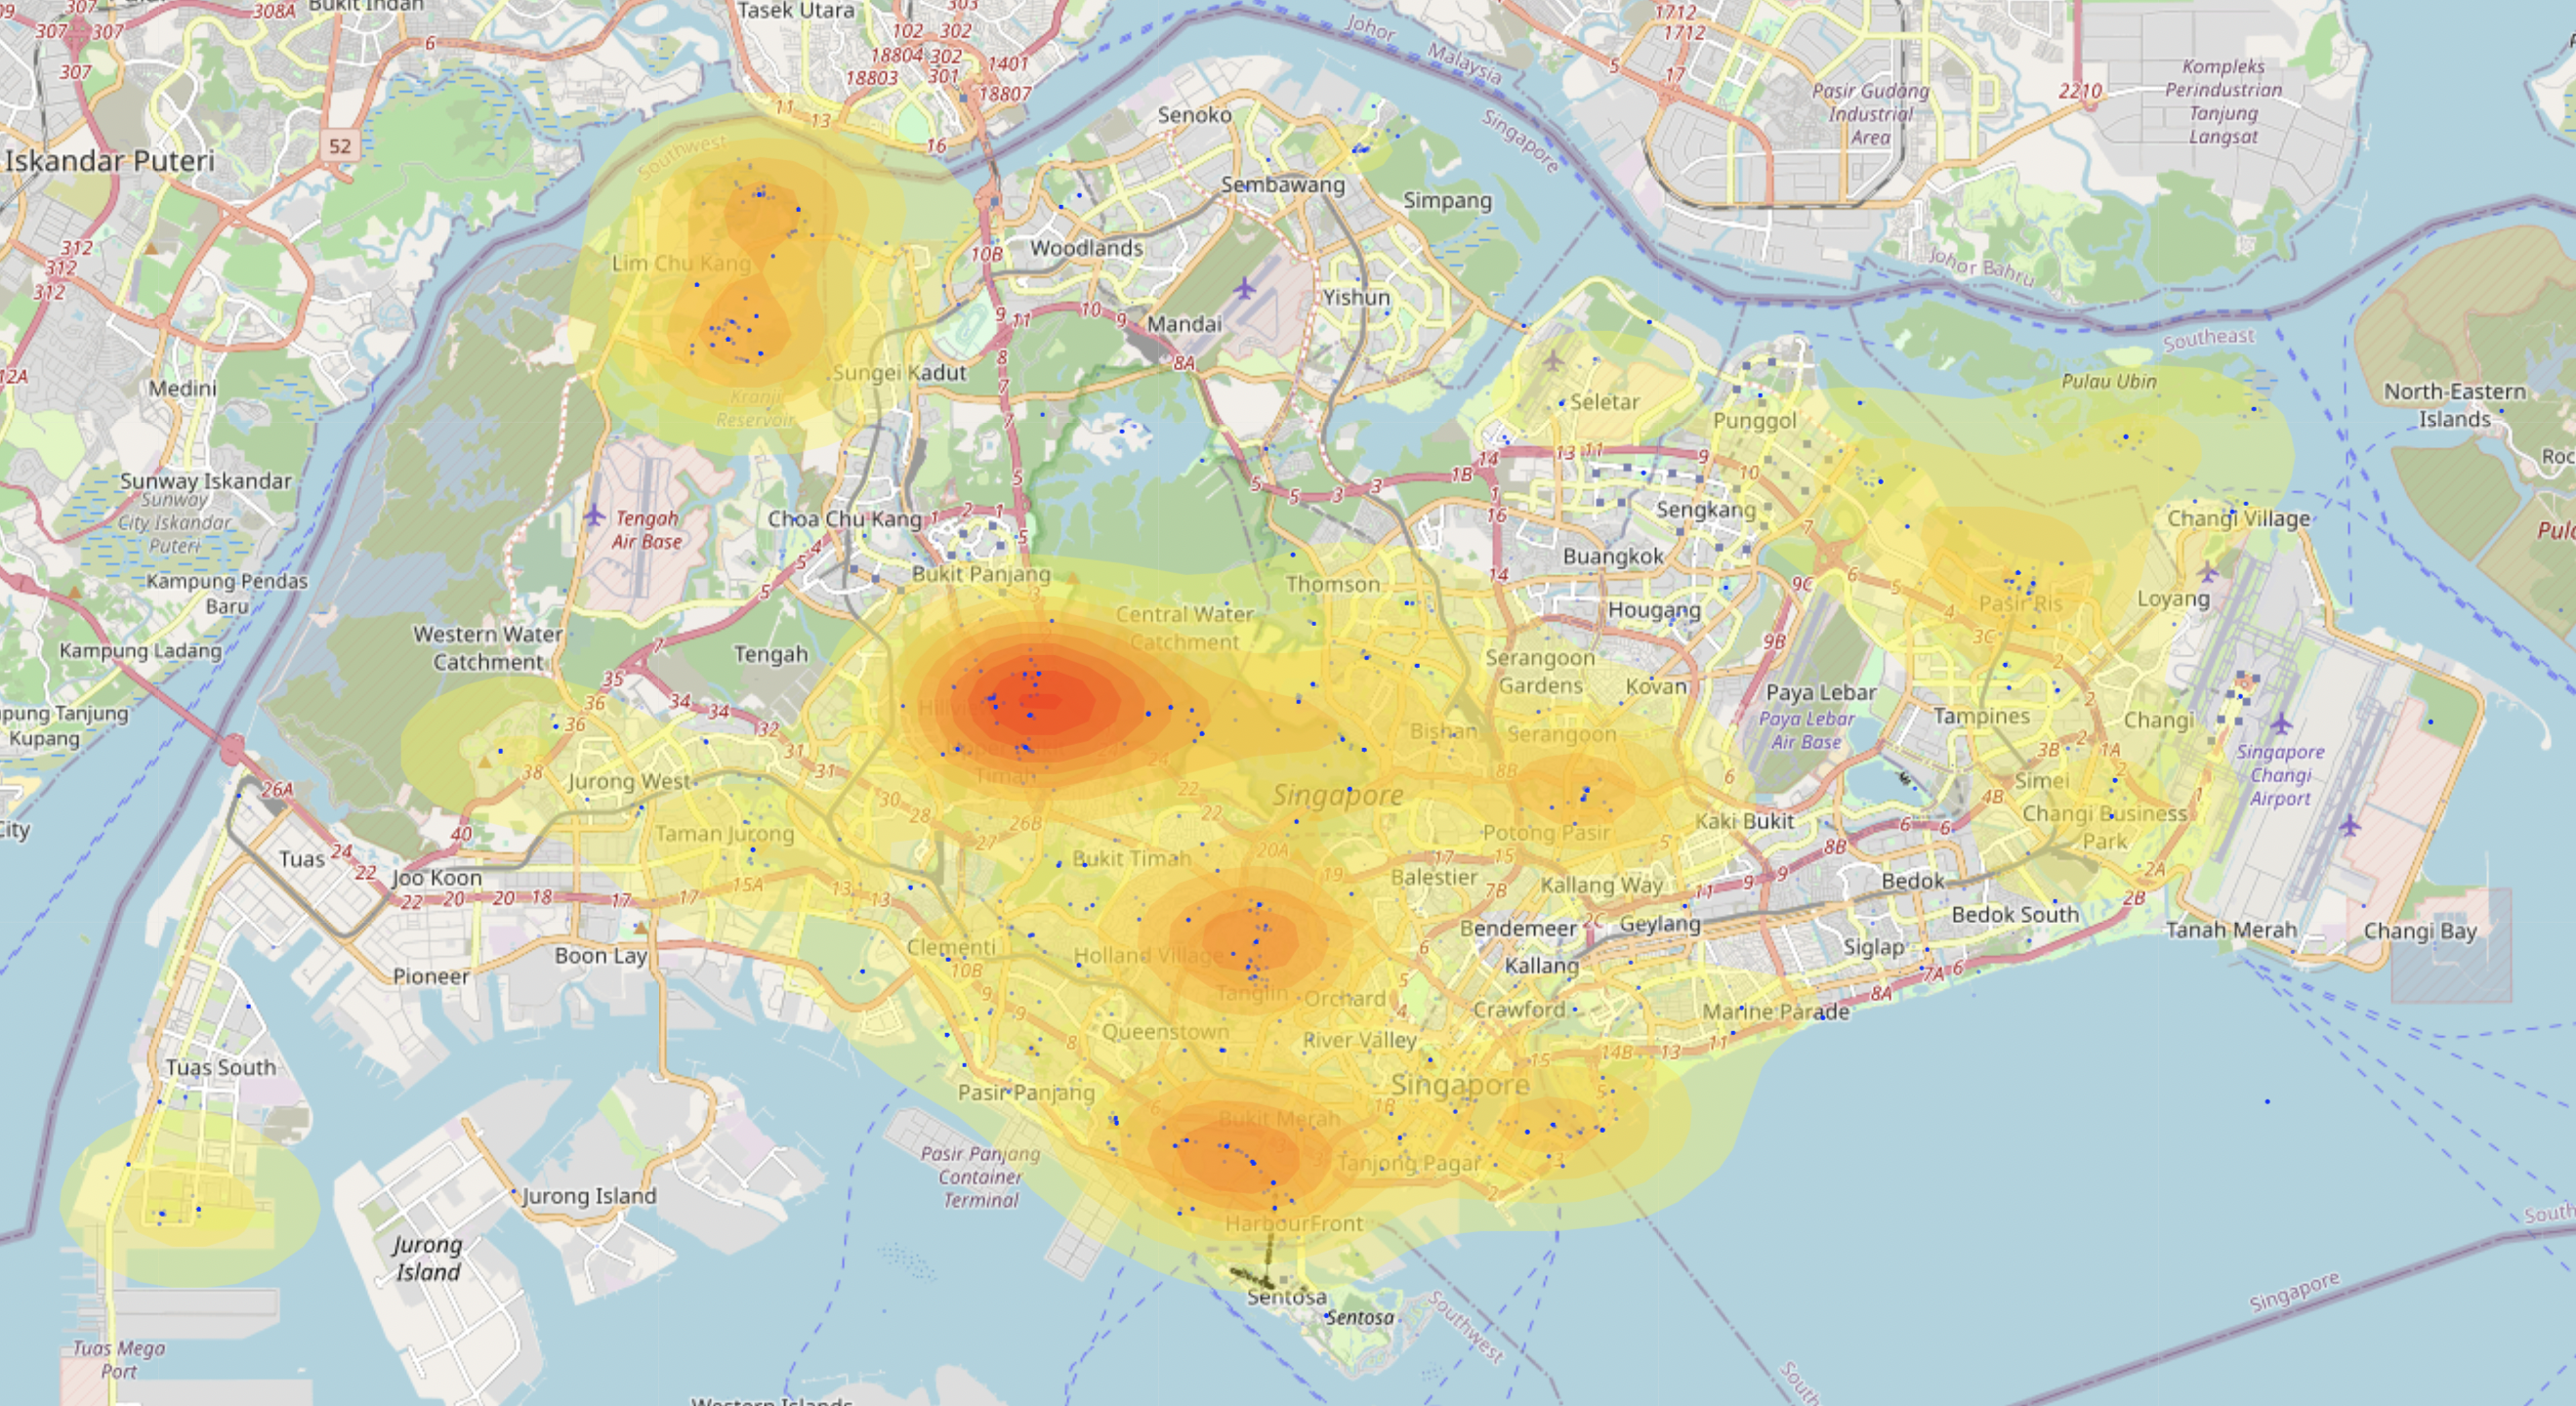
The difference between September and November is stark, despite just the two-month difference. It highlights the shift in observer coverage from shorebird areas in Sep (mainly Sungei Buloh) towards other habitats in Nov.
Method 2
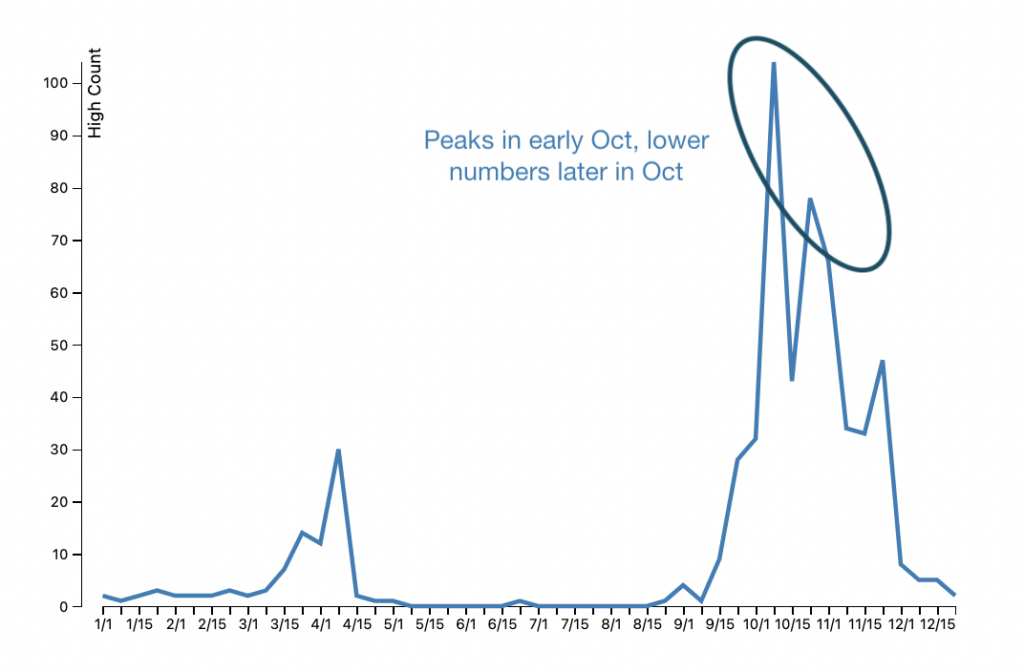
The second indicator used by eBird is the highest count of a bird for a week in history. This also poses major problems. Consider the example of the Japanese Sparrowhawk Accipiter gularis. The highest count was on 13 Oct 2020, with 104 birds, and from the eBird chart, you would imagine Japanese Sparrowhawk is most common in the first half of October. But the highest count for a certain week is not the best way to gauge abundance. To take an extreme example, if we simply take the highest count, 1000 birds split into groups of 100 each would appear like a lower level of an abundance than 104 birds seen once. And indeed, this seems to be the problem with Japanese Sparrowhawks, which are far more common in end-Oct despite the high count telling us otherwise.
Our approach
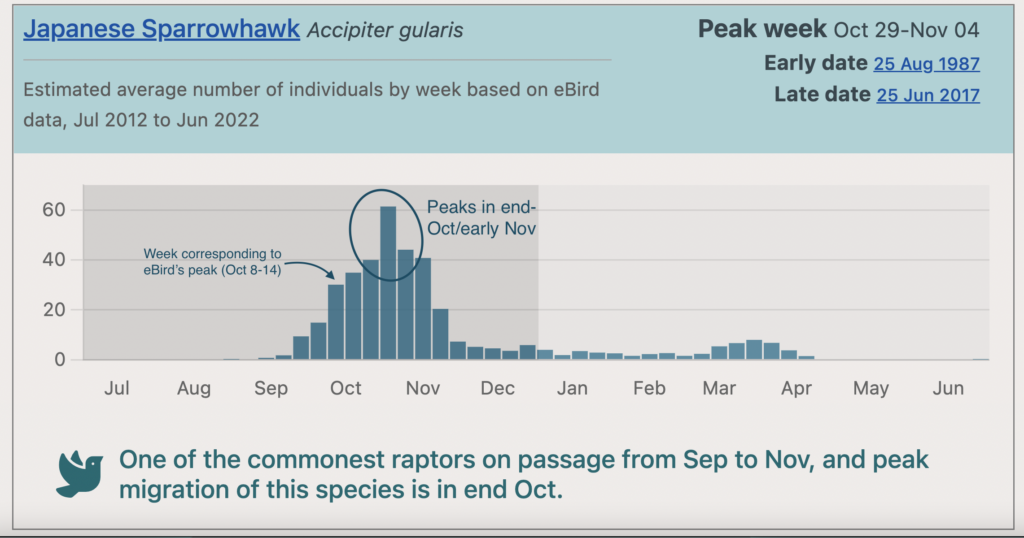
From the above chart taken from our bar charts, you can see the peak for Japanese Sparrowhawk lies closer to the end of Oct, with rising numbers through October and falling numbers in November.
We’ve used eBird bar charts in the past too. We noticed these issues, and set out to design a more robust algorithm which uses all available data rather than only considering high counts or frequencies. The algorithm uses eBird’s dataset of observations too, but processes the sightings differently.
These new bar charts are the product of years of hard work from the Singapore birding community. Your observations have formed the basis for the raw data that we now have access to in eBird. Now, with your help, we have found a way of presenting information that is easily understood and has proper scientific grounding.
In the coming weeks, I’ll be writing about how our algorithm consolidates many thousands of individual eBird data points to estimate the abundance of each species over time – we’re always making an effort to ensure our approaches are firmly rooted in science, and striving to be transparent about it too. (Update: this second post is now posted on our blog as well)